Yellow Rust in Wheat: Why a Few Stripes Can Matter
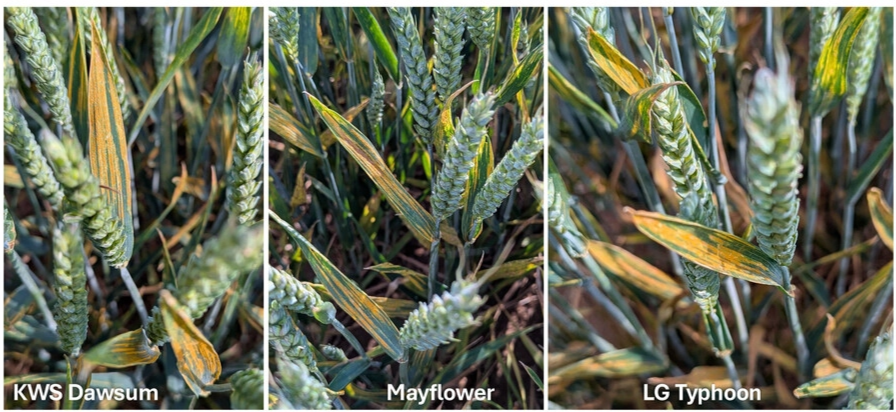
Image Citation: Davis et. al. (2025) New Disease Reports
Yellow rust is easy to underestimate, it’s a disease of timing. Miss it early, and it can cost you. In 2025, the rules changed and the UK's wheat crop paid the price.
The breakdown of resistance offered by the Yr15 gene meant several widely-grown varieties lost up to five points on their yellow rust resistance ratings almost overnight, including popular UK varieties KWS Dawsum, LG Beowulf and Champion. In total, 49% of UK wheat was at risk through thus loss of protection. It was a sharp reminder that in plant pathology, yesterday's protection is not guaranteed tomorrow. Understanding why yellow rust behaves the way it does and how to read it in the field has never mattered more.
What is Yellow Rust?
Yellow rust (Puccinia striiformis f. sp. tritici.) is a fungus that only grows on living tissue and spreads through airborne spores. It gets it’s name from the rows of yellow-orange pustules that stripe along infected leaves and release spores (urediniospores) for further infection.
At first, it may only show as a few yellow-orange stripes on a wheat leaf. But under the right conditions, those stripes can become the start of a much larger problem. The key to understanding how to deal with Yellow Rust depends on canopy temperature, humidity and knowing the life cycle of the fungus.
Yellow Rust Growth is Weather Dependent
Yellow rust likes cool, damp weather. Infection is favoured when leaves stay wet or humid for several hours, especially around 10–15°C. One practical threshold used in disease-warning work is relative humidity above 90% for at least four hours, with suitable temperatures and rainfall helping infection to start. This is why yellow rust often builds after dewy nights, light rain, and still, humid mornings. The crop canopy matters too. A thick crop can hold moisture around the leaves for longer, giving spores more time to germinate and infect.
Once infection happens, symptoms do not appear immediately. The fungus grows inside the leaf first. This hidden stage is called the latent period. In field studies, yellow rust incubation and latent periods have ranged from about 9–19 days, depending on weather. Under favourable conditions, yellow rust can complete more than two cycles per month. That means a small amount of visible disease can build quickly if cool, damp conditions continue. In warmer or drier conditions, the cycle slows. Infection rarely occurs below about 2°C and stops above about 23°C, while growth is fastest around 12–15°C.
Reading the Field: What Patterns Tell You
Wind and humidity decide where the next infections appear.
In high humidity, many spores remain in small clumps. These clumps are heavier, so they fall out of the air quickly, often within meters from the host plant. That tends to create local hot-spots around infected plants. In lower humidity, spores separate more easily and can travel further, creating a more even pattern across the field or spreading between fields.
The green bridge matters as well. Yellow rust needs living host tissue to survive between seasons. Volunteer wheat and early-sown susceptible crops can carry low levels of rust through quiet periods. Once autumn or spring temperatures become suitable, that background infection can start building again.
This gives you a useful way to read the field.
Dense, localised hot-spots
A cluster of severely infected plants surrounded by relatively clean crop typically indicate local spread from an initial infection focus, often in a wetter, more sheltered part of the field, or from volunteer wheat that has carried low-level infection through the winter (the "green bridge").
Diffuse, even distribution across a field
Suggests wider spore movement, often linked to periods of drier conditions that allow spores to disperse further before depositing.
Symptoms on headlands, field margins, or sheltered hollows
Often indicate wind-driven immigration of inoculum from external sources, or persistent green bridge sites.
Variety choice still matters, but it is not fixed forever.
In 2025, the UK saw a major change in yellow rust risk when a new strain overcame the Yr15 resistance gene. Yr15 had provided strong protection in several commercial varieties. Its breakdown led to large falls in some winter wheat yellow rust resistance ratings, with some varieties losing up to five rating points. This does not make resistance ratings useless. They remain one of the best starting points for judging risk. But they should sit alongside what is actually happening in the field.
A practical yellow rust check should bring together five signals:
Variety risk. Is the variety still behaving as expected this season?
Visible disease. Are symptoms isolated, patchy, or widespread?
Recent weather. Have there been cool, damp, humid nights?
Forecast weather. Are the next 7–14 days likely to favour another cycle?
Crop structure. Is the canopy dense enough to hold moisture?
That final point often gets overlooked. Yellow rust is not just a weather-station disease. The fungus lives in the crop canopy, where humidity, leaf wetness, airflow, and plant density can differ from the open air.
This is why yellow rust decisions sit between two risks.
Spray too late, and the disease can remove green leaf area before the crop builds yield. Spray when the disease has little chance of developing, and the farm carries extra cost and unnecessary pesticide use. The aim is not to react to every stripe in the same way, Yellow Rust isn’t random. It follows biology, weather, crop structure and time. Read those signals clearly, and it becomes easier to act before the disease gets ahead of the crop.
At Moat, we are building high-resolution yellow rust risk models that combine open-source data such as weather, with a farmer’s on-site data to give growers actionable intelligence when it matters most. Contact us now to see how we can help mitigate your yellow rust risk or how else Moat can help protect your farm.
Sources: AHDB Yellow Rust Hub (ahdb.org.uk/yellowrust); El Jarroudi et al. (2025), Ecological Modelling 510:111318; El Jarroudi et al. (2020), Applied Mathematics and Computation 376:125107; de Vallavieille-Pope et al. (1995), Phytopathology 85:409–415; Zadoks (1971), Phytopathology 61:600–610.